
Graphing
Data mapping is the process of embedding data into a visual representation, as in a map or graph, in addition to making data easier to comprehend and extract insights from. Data visualization’s major purpose is to make it easier to identify correlations, tendencies, and oddities in massive data sets. Computational graphs provide a general autonomous tool for modelling simulation designs. Correlations are frequently represented using graphing. Data and analysis engineers should ideally be familiar with the tools available for testing hypotheses and engaging with data.
Complementary data found in graphs will most likely be used to add legitimacy. DEP MeshWorks graph is a powerful data analysis and plotting tool. It has a comprehensive set of plotting capabilities, user-friendly interface, simple navigation from one function to the next, and is fully integrated into the MeshWorks interface. The tool includes built-in math functions that make it simple to process mathematical expressions for plotting CAE simulation results.
Functions
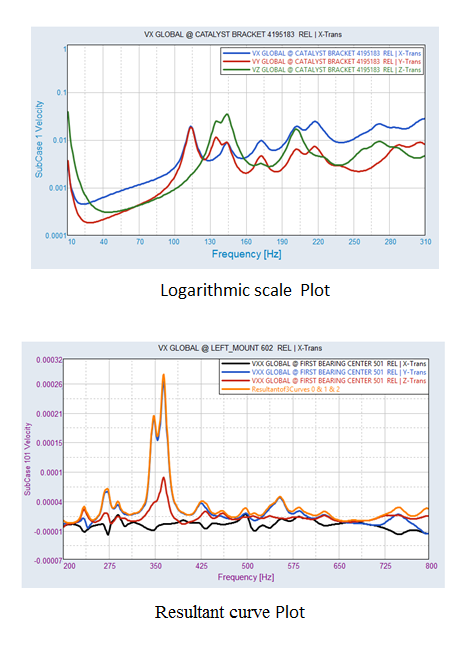
- Plot Axes: Allows the user to change linear scale to logarithmic scale.
- Plot Macro: Allows the user to plot the resultant curve.
- Coordinate info: Allows user to see the maximum and minimum points of the curves.
- Legend Attributes: Displays the curve details. The user is then able to change attributes like line style, color, weight.
- Curve Scale Offset: Allows the user to perform curve scaling, offsets can be applied to multiple curves.
- Curve Math: Allows the user to create new curves using expressions and values.
- Header/Footers: Allows user to edit header/footers.
- Datum Line: Allows user to create line in user defined location in both horizontal and vertical axes.
- Curve Attributes: Allows the user to define attributes like line style, color, weight, symbol style and color.
- Graph–Notes: Annotations display the curve details. The user can add notes to provide extra information if needed.
Benefits
- Integrated graphing user interface within MeshWorks Pre/Post.
- Inclusive of Post Processing results from Nastran(*pch) solver output.
- Multiple Punch files can be appended and used for plotting curves.
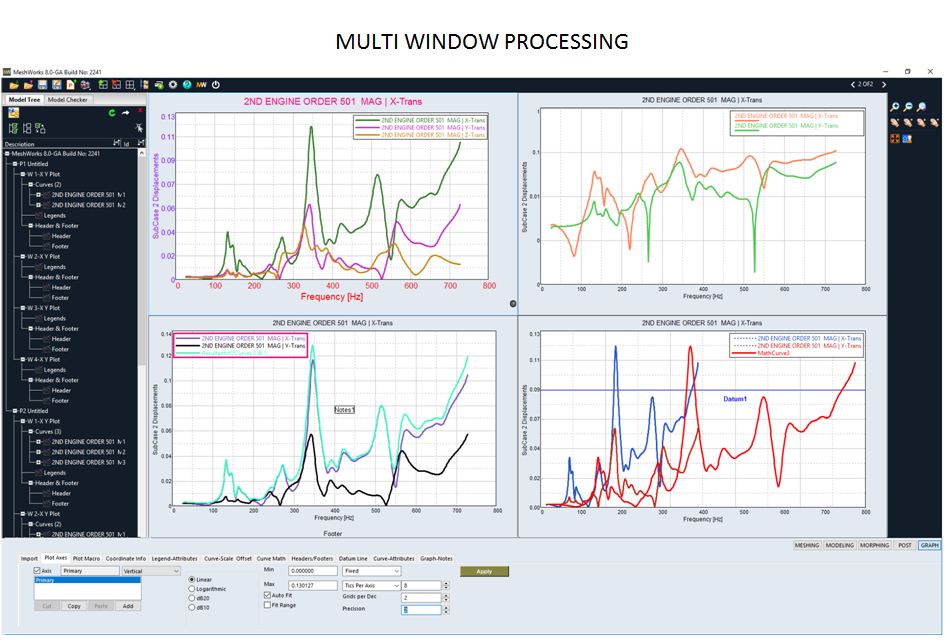
- Multi- page and multi- window post processing of results with easy transfer of settings from one window/page to another.
- XML based session file saving.
- Session files can be replayed.
- With a large network, Graph theory will help you create maximum flow capability.


